Scientific publications
Scientific publications (monographs, textbooks, teaching aids, etc.) of employees and students of the department
Table 1. Number of measurement days (N days) and data points (N points) at IAOCA-KRSU in 2022-2023. (Level 1.0) and the number of days identified as cases of removal of Asian (A_Dust) and Middle Eastern (ME_Dust) dust (Dusty days) and smoke (Smoky days)
|
Year |
2022 |
2023 |
Total |
||||||||||
|
Month |
Sep |
Oct |
Nov |
Dec |
Jan |
Feb |
Mar |
Apr |
May |
Jun |
Jul |
Aug |
|
|
N days |
25 |
20 |
19 |
18 |
25 |
13 |
26 |
22 |
22 |
23 |
26 |
24 |
263 |
|
N points |
708 |
402 |
165 |
269 |
369 |
219 |
740 |
564 |
510 |
597 |
446 |
623 |
5612 |
|
Dusty days |
8 |
5 |
2 |
0 |
2 |
2 |
10 |
10 |
9 |
6 |
3 |
6 |
63 |
|
Smoky days |
2 |
0 |
0 |
0 |
0 |
0 |
0 |
0 |
4 |
4 |
1 |
1 |
12 |
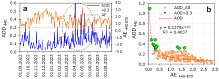
Variability of daily average values of AOD440 and AE440-870 at the IAOCA-KRSU station (a) and the corresponding dependence of AOD440 on AE440-870 (b)
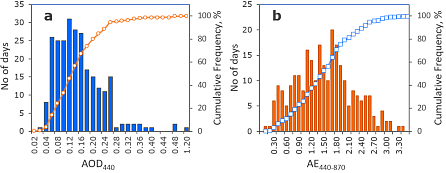
Integral repeatability distributions and histograms of measured values AOD440 (a) and AE440-870 (b)
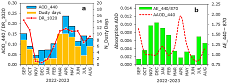
Variability of monthly averages of AOD440, depolarization ratio DR1020 and number of dust days (N_Dusty Days) (a), and absorption AOD and Angstrom score AE440-870 (b) in 2022-2023.
Research has shown that radiometric measurement data reflect changes in the emission of dust, biomass combustion products and anthropogenic aerosol from sources in the Middle East, Europe, Russia, the Aral Sea basin, and the deserts of northwestern China depending on the season. The highest levels of atmospheric aerosol load (AOD440≥0.3) were a consequence of the removal of large mineral dust particles that predominate in spring and autumn (AE440-870 ≤0.5).
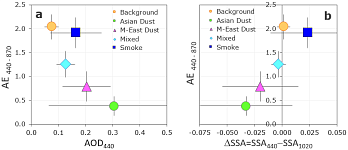
Comparison of the optical thickness AOD440 (a) and the difference between the single scattering albedo SSA440 and SSA1020 (DSSA) (b) from the Angstrom parameter AE440-870
The vast majority of the atmospheric aerosol in the region is supplied by natural sources, due to its geographical location relative to the so-called. «belt of dust», which stretches from the western coast of North Africa, covering the Sahara, the deserts of the Arabian Peninsula, Iran and northern Pakistan, the Aral Basin to the Taklamakan and Gobi deserts.
Events identified as Asian dust removals from deserts in northwestern China dominate all other emission regions in both the boundary layer and the free troposphere. The transfer of dust and anthropogenic aerosol from Middle East sources is carried out primarily in the middle and upper troposphere and does not directly affect the levels of surface mass concentration of airborne particles (PM).

Seasonal variations in PM2.5 major components in Central Asia
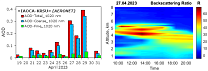
Time course of AOT-Total, AOT-Fine and AOT-Coarse (Level 1.5) at 1020 nm («IAOCA-KRSU», AERONET) in the period 19–31 April 2023 (a) and altitude-time changes of R1064 (h) as measured by lidar sounding from 09:00 to 21:00 (Local Time) on 27 April 2023 (b)
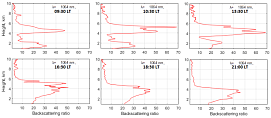
Transformation of vertical scattering ratio (R) profiles at 1064 nm obtained by terrestrial lidar between 09:00 and 21:00 (LT) on April 27, 2023.
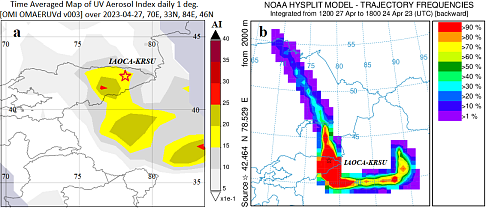
Distribution map of the Atmospheric Aerosol Index (AI) as reported by the Aura Satellite (OMI) during the Asian Dust event on 27 April 2023 (a). Frequency distribution of 24 reverse trajectories passing over the observatory (42.46° N; 78.53° E) at an altitude of 2000 m above the surface (AGL) between April 24 (12:00 UTC) and April 27 (18:00 UTC) 2023 (b)
The results of the analysis of PM samples during anomalous events showed that in the region under study, carbon-containing components (OS and EC) make a significant contribution to the mass concentration of particles with an aerodynamic diameter of less than 2.5 mm (PM2.5). Sources of organic carbon (OC), elemental carbon (EC) and water-soluble organic carbon (WSOC) under conditions of regional and transcontinental transport of atmospheric aerosol particles have been established.
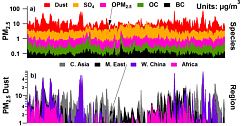
Simulated PM2.5 composition at the REB site (LST) by species (a) (mg m-3) and by region source (b) of fine dust (mg m-3)
Empirical relationships between the aerosol optical thickness AOD and the mass concentration of PM2.5 have been obtained, which make it possible to estimate the surface values of PM2.5 based on optical measurement data.
Variations in meteorological parameters in the upper troposphere and lower stratosphere (UTLS) were analyzed in order to isolate disturbances that may be associated with earthquakes of magnitude M≥ 7.0 that occurred in the regions of Eurasia in 2023–2024, which is important to confirm previously identified pre-seismic atmospheric effects and to verify the effectiveness of the applied algorithms for processing satellite remote sensing data.
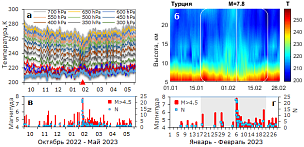
Altitudinal-temporal changes in atmospheric temperature over the epicentral zone of the earthquake M=7.8 in Turkey and the corresponding dynamics of seismic activity in October 2022-May 2023 (a, c) and in January-February 2023 (b, d)
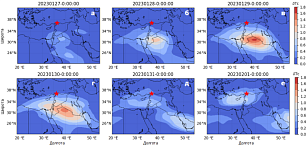
Spatial distribution dynamics of the integral parameter dTC before earthquakes M>7.0 in Turkey from January 27 to February 1, 2023.
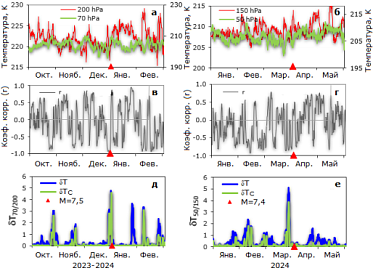
Variations in temperature (a, b), correlation coefficient (r) (c, d) and integral parameter dTC (e, e) in October 2023 – February 2024 over the epicenter of the earthquake M=7.5 in Japan (01/01/2024; 07:10:09 UTC) and in January – May 2024 over the epicenter of the earthquake M=7.4 in Taiwan (04/02/2024; 23:58:12 UTC)
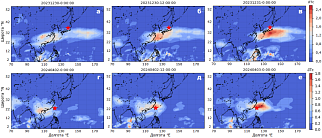
Spatial distribution of the dTC parameter before the M≥7.0 earthquakes in Japan on March 30-31, 2024 (a, b, c) and in Taiwan on April 2-03, 2024 (d, d, e)
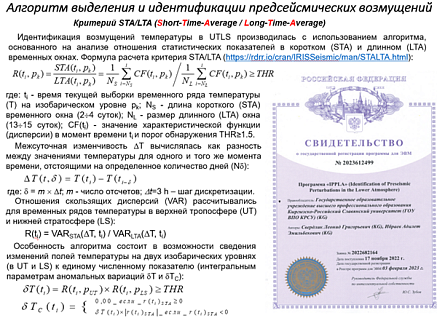
One feature of the Upper Troposphere and Lower Stratosphere Vertical Structure (UTLS) is the changes in linear regression coefficient profiles between tropopause altitude and temperature, which are typically S-shaped with negative correlation coefficients above the tropopause (~100 hPa) and positive values in the upper troposphere (~300 hPa). Observations of temperature changes at these two UTLS levels were at the heart of the developed satellite data processing algorithm. The intensity of temperature variations was estimated by comparing the sliding variances VAR in the short STA (Short Time Averaging) and long LTA (Long Time Averaging) time windows: R = VARSTA / VARLTA, followed by the calculation of the integral parameters dTC (dT). Temperature dispersion was seen as a measure of the activity of various disturbing factors, including gravitational waves, the generation of which may be related to seismic activity. The disturbed state of the upper troposphere (UT) and lower stratosphere (LS) corresponded to temperature fluctuations satisfying the conditions: RUT>1.0 and RLS>1.0, respectively, and the values of the dTC parameter > 1.5 were considered anomalous. The use of a two-tier approach increased the likelihood of detecting thermal anomalies preceding earthquakes, as confirmed by examples of analysis of temperature variations in seismically active regions of Europe and Asia. In addition, it made it possible to reduce the number of false positive thermal anomalies (i.e., not accompanied by earthquakes).
The identification of pre-seismic temperature anomalies in UTLS was based on three known positions of the DTS-T (Deviation-Time-Space-Thermal) criterion: (1) significant deviation of the observed parameter from its background values; (2) quasi-synchronous behavior of anomalies over time; (3) spatially stable anomalies located near epicentral regions. The spatial characteristics of temperature disturbances were determined using the IPPLA (Identification of Preseismic Perturbations in the Lower Atmosphere) software application.
The use of the developed algorithm made it possible to establish that anomalies of seismogenic origin, characterized by high values of the anomaly parameter dTC (≥2.0), manifested themselves in the form of well-defined mesoscale (300-800 km), relatively long-lived (from 18 to 36 hours) disturbed areas localized near epicenters. DTC maxima were observed within a few hundred kilometers from epicenters and 1-5 days before strong earthquakes.
The repeatability of the results obtained leaves little doubt that seismic activity is one of the sources of variability in atmospheric parameters. Regarding the question of the possible mechanism of formation of disturbances preceding large earthquakes, it can be assumed that, depending on the conditions, different mechanisms of interaction between the lithosphere and the atmosphere (geochemical, acoustic-gravitational and electromagnetic) coexist and contribute to the formation of disturbances.
The results of the analysis give reason to assume a likely connection between abnormal changes in weather parameters in the upper troposphere and lower stratosphere with seismic activity. In all the cases studied, mesoscale regions of abnormal temperature disturbances were formed near the epicenters. This may mean that pre-seismic effects occurring on the Earth's surface lead to changes in atmospheric parameters.
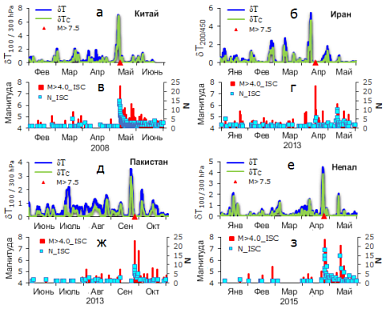
Dynamics of changes in the parameters dT and dTC (a, b, d, e) and the sequence of magnitudes and numbers of earthquakes (N) (c, d, f, h) during seismically active periods in China (2008), Iran, Pakistan (2013) and Nepal (2015)
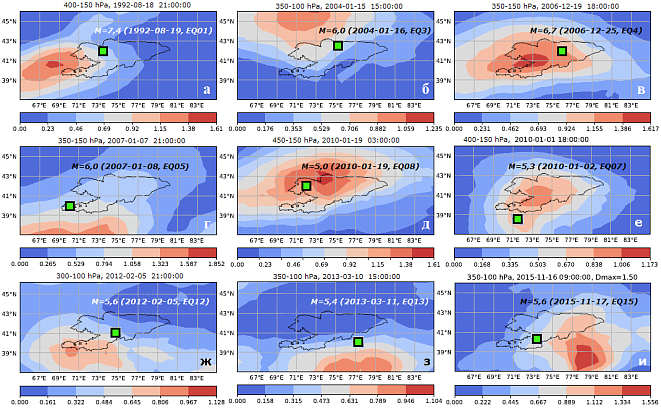
Spatial distribution of temperature disturbances expressed by the values of the integral parameter of anomalous variations DCORR, during the preparation periods of earthquakes with magnitudes M³ 5.0 that occurred on the territory and near the boundaries of the CD